
The Power of the Power Law, “super-stars”, and moving the returns curve “to the right”!
- By ssyc1
- February 21, 2019
- No Comments
I finally get to jot down some of my thoughts here about the “power law”, and more specifically the “power of the power law” ….
I. The phenomenon of superstars
OK, I’ll explain imminently, but to connect this with other people thinking about similar things, I wanted to share a few sentences from McKinsey’s recent report that talked about “super-stars”. In highlighting “super-stars” in an October 2018 “discussion paper” entitled “Superstars: the dynamics of firms, sectors, and cities leading the global economy”, McKinsey referred also to the power of the power curve, writing that:
“Amongst firms, economic profit is distributed along a power curve, with the top 10 percent of firms capturing 80 percent of economic profit among companies with annual revenues greater than $1 billion. The middle 80 percent of firms record near-zero economic profit in aggregate, while the bottom 10 percent destroys as much value as the top 10 percent creates.”
In fact, its analyses show that the “super-star” effect has strengthened in the last 20 years:
“Over the past 20 years, the gap has widened between superstar firms and median firms, and also between the bottom 10 percent and median firms. Today’s superstar firms have 1.6 times more economic profit on average than superstar firms 20 years ago. Today’s bottom-decile firms have 1.5 times more economic loss on average than their counterparts 20 years ago, with one-fifth of them (a growing share) unable to generate enough pretax earnings to sustain interest payments on their debt. The growth of economic profit at the top end of the distribution is thus mirrored at the bottom end by growing and increasingly persistent economic losses, suggesting that in addition to firm-specific dynamics, a broader macroeconomic dynamic may be at work”.
II. It is easy to be displaced as superstars
Fortunately, there is much mobility (or probably what Schumpeter would call forces of “creative destruction”):
“Superstar firms continue to be displaced from the top 10 percent and the top 1 percent. Indeed, some firms have risen from the bottom 10 percent to higher deciles, a few all the way to the top 10 percent.”
A similar power curve dynamic (or the “superstar effect”) applies to sectors too, even if slightly less strongly:
“We analyze 24 sectors of the global economy that encompass all private sector business establishments. We find that 70 percent of gains in gross value added and gross operating surplus have accrued to establishments in just a handful of sectors over the past 20 years. This is in contrast to previous decades, in which gains were spread over a wider range of sectors.”
It is interesting also that the term “super-star” was originally used in the context of individuals such as artists and athletes, as McKinsey highlighted – and some of us on our team have been top performing artists and athletes, so we instinctively know this – and they are adopting the term for firms, sectors and cities! The analyses also show how, amongst other things, superstar firms achieve outsize gains in market share for marginal improvements in productivity, regardless of their starting market position.
III. The power of the power law in venture investing
But the venture investing business is so very much about the power law, or the power of the power law! This is the distribution of returns: one of my very first mentors in this business told me that only 10% make money.
A generic power law shape looks like this.
The investment returns of companies that got (VC-) funded in 2004 to 2013 using data from over 20,000 financings as seen in an exercise by VC firm Correlation Ventures showed a very similar shape:
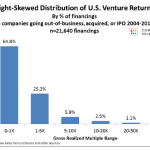
This is not a surprise when you look at the survival rates of firms as it grows …McKinsey in a different, earlier report entitled “Grow fast or die slow” already showed how (Exhibit 3), out of a total of almost 3,000 software companies that started in 1980, only 96 (~3%) reached the revenue mark of US$1 billion and an even smaller number of 17 (~0.5%) reached US$4b billion or above. The skewness is very obvious!
One way some veterans of the Silicon Valley VC system express the same point is to remind everyone that the 100th employee at Google did much better than the average venture-backed CEO did in the last decade.
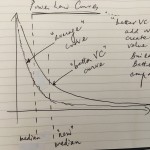
IV. Start with the power law curve but making the returns curve on a fund basis move “a little to the right”
A few months ago, I had a really interesting question from a founder about the expected returns from a VC fund which necessitated me explaining – amongst other things – the “power” of the power law and how in my job I try to move the power law “a little bit to the right”** (with some initial investment discipline as well as scale-up skills!) … This was my drawing which seemed to have had a positive reception and triggered some further interesting discussions ….
I stress that creating a power curve that is more “to the right” (and with a “thicker tail”) is not just about choosing the right companies; it is equally about finding the investments where we actually add value and create value to the companies we fund on top of the $ we invest (we wrote earlier about “what an investment decision mean to us“). Of course, how to create a power curve more to the right as we put together our portfolio is an art as much as it is a science but it is an important – and we believe very critical – part of our job.
But the mindset is important, and we often have to remind ourselves to avoid adopting “average thinking” or “linear thinking” in this business. We are always using “options thinking”, “probability thinking” and “exponential (power curve) thinking”. We are in the business of creating and helping create non-linear growth. (It is funny we don’t use much complicated maths in our work, we just use a certain mathematical way of thinking, as much as other non-mathematical way of thinking). More on this another time.
** We would like to be clear – for those highly mathematically inclined – that if returns did strictly follow a 1/x type of power law, then what we would be seeking to do is to create a power curve with a “fatter tail”, a “shorter” curve and getting the right side of the power curve “fall less fast”(or what is technically called a lower “alpha”), so it is not literally moving the curve to the right.


Leave a Reply